Wednesday, January 23, 2013

Milepost 31 - SR 99 Tunnel Project Information Center

Milepost 31 Information
Milepost 31 InformationMilepost 31 Information
Milepost 31 is an information center where the public can learn about the history of Pioneer Square and the new SR 99 Tunnel Project. The folks manning the center on the day we stopped by were friendly and eager to share all sorts of facts and figures about Pioneer Square, the Tunnel Project, and Seattle in general. In fact, to understand the goals and challenges of the SR 99 Tunnel Project you need to go back in time and understand how Seattle has grown from the first inhabitants in the early 1850s to the present day. The first settlers lived on a piece of land (approximately today’s Pioneer Square) that bears little resemblance to today’s city outline. Generations of fill matter enlarged the city to its current shape. In fact, the bit of information that stuck in my mind the most was from a Milepost 31 Brochure called 20,000 Years in Pioneer Square (shown below) which shows how the shape of the city has changed since the 1850s. The historical shoreline overlaid on the modern city is an eye-opener. The information is also captured in a Burke Museum exhibit at Milepost 31 and a web overview titled Waterlines. In the web presentation, there is a plan of the city from 1856 drawn during the Battle of Seattle, which shows a spit of land that looks nothing like the current city outline. It’s amazing what fill and time can do to reshape a city.

The path of the tunnel doesn’t just follow the existing viaduct - as we initially assumed. At Yesler the tunnel path runs further away from the water than the current viaduct. For city buildings it passes under, right of ways had to be purchased. Along the way the tunnel will run through a variety of soil types: sand and gravel, clay and silt, and silt and fine sand. See the photo of the soil types below. If you ask, they folks at Milepost 31 will roll out the soil map for you!

The SR 99 tunnel is projected to open in late 2015. It will be about 2 miles long and have 4 lanes (2 in each direction). Construction has started, but boring hasn’t. (It’s not boring, ha ha.) The tunnel boring machine is still being tested in Osaka Japan. It was built by the Hitachi Zosen Corporation and is the world’s large-diameter (57.5 feet) tunneling machine. And, its name is Bertha.

Milepost 31 doesn’t cover much of the process that led to the select of the tunnel (or at least we didn’t see it). It was a process with political twists and turns, votes, and finally, a decision handed down. (Read more.) I guess Bertha can only go in one direction so why look back now?

Left: Scaled-Down Model of the Boring Machine at Milepost 31, Right: SR 99 Tunnel Depiction
Scaled-Down Model of the Boring Machine at Milepost 31 SR 99 Tunnel Depiction

20,000 Years in Pioneer Square Brochure – Changes in the Shape of Seattle
20,000 Years in Pioneer Square Brochure – Changes in the Shape of Seattle 20,000 Years in Pioneer Square Brochure – Changes in the Shape of Seattle

 20,000 Years in Pioneer Square Brochure – Changes in the Shape of Seattle 20,000 Years in Pioneer Square Brochure – Changes in the Shape of Seattle  

Left: Map By Drawn by Lieutenant Thomas S. Phelps of the Decatur and photographed by an unknown photographer. Map Drawn for Battle of Seattle. Via Wikimedia Commons.  Right: View of Seattle from What Used to Be Part of the Bay
Map By Drawn by Lieutenant Thomas S. Phelps of the Decatur and photographed by an unknown photographer.View of Seattle from What Used to Be Part of the Bay

Soil Types and SR 99 Tunnel Profile
Soil Types and SR 99 Tunnel ProfileSoil Types and SR 99 Tunnel Profile 

You’ll Dig It – Or Maybe Not if You Didn’t Vote for It.
You’ll Dig It – Or Maybe Not if You Didn’t Vote for It. You’ll Dig It – Or Maybe Not if You Didn’t Vote for It.

Monday, January 21, 2013

Intel Museum : Journey Through Decades of Innovation


Left: Intel 4004 Chip Board – Blown Up, Right: Intel 4004 Chip Board Legend
Intel 4004 Chip BoardIntel 4004 Chip Board Legend

A couple of weeks ago we were in the Silicon Valley and stopped at the Intel Museum in Santa Clara. The museum, billed as a “fun, interactive learning experience for children and adults,” is housed in the Robert Noyce Building on the Intel campus. The museum space has a fun futuristic feel - what would you expect - all blue and white and looking like the cross between the inside of a space station and a computer chip.

Intel was founded in 1968 by Robert Noyce and Gordon E Moore of the Moore’s Law fame. Most of us are familiar with Intel from the “Intel Inside” publicity of the 1990s as Intel was the maker of the chips inside many computers at that time. However, they started out in the 1970s producing memory (RAM and ROM) switching to chips in the early 1980s under the leadership of Andy Grove.

In our device-obsessed world, where we spend a good part of our day staring a device screen of some sort, it’s hard to appreciate at first glance what is shown in the museum. For example, what are 4004, 8080, and 80386 chips anyway? The Intel 4004, released in 1971, was the first complete CPU (microprocessor) on one chip. It has a data bus width of 4-bits - a measure of the size of the data that could be worked with in one instruction cycle. The 8080 was another step along the way, an 8-bit processor introduced in 1974. The 80386 is part of the x86 architecture, 32-bit microprocessor introduced in 1985. And so on. Each was an important step on the way to where we are today. Each step an improvement over the last step.

On display in the Intel museum was an Altair 8800 (based on the Intel 8080 CPU), looking more a like piece of exotic audio equipment than the first microcomputer. A few weeks later we would be at the Museum of History and Industry (MOHAI) back in Seattle where there is an exhibit summarizing the history Microsoft and we came across the Altair again. In this context, it was what a then 19-year old Bill Gates and 22-year old Paul Allen “wrote a version of BASIC, the first programming language for the world's first personal computer.”

Left: Altair 8800 at the Intel Museum, Right: Altair 8800 at MOHAI in Seattle
Altair 8800 at the Intel MuseumAltair 8800 at MOHAI in Seattle

At the same time we were visiting the Intel museum, we were reading and listening to the book Antifragile: Things That Gain from Disorder by Nassim Nicholas Taleb. I was particularly drawn to Chapter 20: Time and Fragility where Taleb talks about what happens when people try to imagine the future: they basically start with the present as a baseline and add more to that. Taleb suggests that a better approach is to reduce, simplify the vision of the future which is in accordance with the notions of fragility and antifragility discussed in his book. Maybe, this is part of the scratch-my-head reaction to the Intel exhibits? My mind is trying to do a reverse extrapolation. I know where we are today and I’m looking at older technology trying to see the arc that connects it and all I can do is “add” to the older technology but it doesn’t make sense. Maybe we can only extrapolate reasonably successfully from general ideas, not a snapshot of the technology at a given time?

The day after the visit to the Intel museum, we drove from the Silicon Valley back home to Seattle. The trip took 16 hours total with 2 hours stopped spent eating and stretching. All the way back we were plugged into our devices: listening to books, surfing the web and looking for good coffee (surprisingly hard in that stretch of I5) and interesting restaurants. Neither of our devices, an iPhone and Windows Phone, is (ironically) running an Intel chip, something that Intel is working to fix.

Left: Travelmarx – Binary Exhibit at the Intel Museum, Right: Silicon Ingot at the Intel Museum
Travelmarx – Binary Exhibit at the Intel MuseumSilicon Ingot at the Intel Museum

Left: Antifragile Book Cover, Right: Intel Museum Advertisements from the Past: Fragile?
Antifragile Book Cover Intel Museum Advertisements from the Past

Sunday, January 20, 2013

Note On Using the Enphase Power Today Method

Update: June 2015: In the move from v1 to v2 of the API, the power_today method was removed. See the migration guide. Use the stats method instead as show in Working with Your Solar Array Data Using the Enphase API. This information in this post will be kept for archival.

In a previous post Working with Your Solar Array Data Using the Enphase API we talked about using Enphase API data to retrieve data about a solar array and use the data for presentation in a web page. One of the problems (not apparent on first glance) is that the data didn’t have a timestamp. Instead, we were assigning a timestamp equal to the time we made the request.  Our assigned timestamp does not equal the time the data was last updated.

Problem

We use the summary() method to return the energy_today value (Wh), but there is no useful timestamp that indicates as of what time the data is valid. The power_today() method returns values for the full day. Can we get a timestamp from this data? How is this data related to the summary() request?

Solution

We can use the power_today() method to return a timestamp. Furthermore, the data returned from the power_today() method “seems” to be track to the energy_today, but delayed.

Details

Step 1. Get the output of both the summary() and power_today() methods at the same time. In the example outputs below, it is 14:00 (military time). We’ll call this time the request_time.

{"energy_week":34865,"energy_month":94405,"modules":14,"current_power":477,"summary_date":"2013-01-20T00:00:00-08:00","source":"microinverters",
"energy_lifetime":95939,"system_id":XXXXXX,"energy_today":5121}

{"first_interval_end_date":"2013-01-20T00:05:00-08:00","production":[0,0,0,0,0,0,0,0,0,0,0,0,0,0,0,0,0,0,0,0,0,0,0,0,0,0,0,0,0,0,0,0,0,0,0,0,0,0,0,0,0,0,0,0,0,0,0,0,0,0,0,0,0,0,0,0,0,0,0,0,0,0,0,0,0,0,0,0,0,0,0,0,0,0,0,0,0,0,0,0,0,0,0,0,0,0,0,0,0,0,0,0,0,0,5,10,13,17,27,41,51,60,70,77,85,101,116,129,145,156,170,194,225,260,289,330,355,348,336,310,301,344,397,409,393,379,388,401,396,386,364,351,379,419,475,518,512,611,936,1597,2038,1988,2238,2322,2180,2033,2033,2011,1684,1424,1646,1811,1944,2104,2125,2171,2258,2239,2100,1916,1610,1236,1013,924],"interval_length":300}

Step 2. In the power_today() data, we see see that the interval_length is 300 (5 minutes) and first_interval_end_date was at 5 minutes after midnight. So the number of data points indicate the last time the data was updated. In this case, 5 min * 164 points / 60 min = 13.67 or in hh:mm 13:40. We’ll call this the calculated timestamp.

Note, if first_interval_end_date were not equal to interval_length, the timestamp calculation would be a bit more complicated. The more general calculation requires this fact to be taken into account and looks like this:

(Count(data points) * interval_length) ) / 60 min + (first_interval_end_date - midnight ) / 60 min = hours offset

But for the time of reporting we are doing here we can stick with the simpler formula:
(Count(data points) * interval_length) ) / 60 min

Step 3. In the power_today() data, we now sum the data points and get 58924. (Import as CSV into Excel.) The summed value is Watts, to get Watt hours we would take the interval for each data point multiplied by the value of the Watts, sum, and divide by 60 min which gives 4910 Wh. We’ll call this the calculated energy_today.

Step 4. In the summary() data, note that the energy_today value is 5121 Wh which is greater than the value for step 3. We’ll call this summary energy_today.

Step 5. Repeat data collection for a little while to see that the calculated energy_today is about 5-10 minutes behind in this small example. It might be more in different circumstances. Also, who knows what processing might be going on with the summary energy_today value.

request_time calculated timestamp calculated energy_today summary energy_today
14:00 13:40 4910 5121
14:10 13:55 5142 5257
14:15 14:00 5205 5364
14:20 14:05 5282 5447
14:25 14:10 5377 5557
14:30 15:25 5481 5557*
14:35 15:20 5702 5869

* We just happened to catch a glitch where the value did not update, which can happen.
So on first glance it looks like we can use the power_today() values to help establish a timestamp. You might be thinking, if we are lazy, on average we could say that the summary energy_today has a timestamp of request_time minus 5-10 minutes. That would apply in an ideal world of consistent data updates. But what if the web service stopped reporting new data points because?  In that case, we would want to know this and the calculated timestamp would indicate it.   So, if you are after a more precise timestamp use the calculated timestamp.


Monday, January 14, 2013

Elles:Pompidou - Women Artists from the Centre Pompidou, Paris


A Collage of Some of Our Favorite Artists at Elle:Pompidou Exhibition
This exhibition ran at the Seattle Art Museum (SAM) from Oct 11, 2012 - Jan 13, 2013. We caught it on the last day. I was a bit hesitant to attend as I kept hearing things like “the show is daring” and “bound to have everyone talking” which works in reverse for me in terms of generating interest. The exhibition introduction states that the survey isn’t about feminist art, but rather a show of the diversity of women artists in the 20th century. And that it is.

We spent the bulk of our time with the elles:pompidou works on the fourth floor and considerable less time at the companion exhibit elles:sam on the third floor. The real standout in elles:sam was the large space dedicated to Yayoi Kusama. According to the SAM guide: “Plagued with hallucinations since childhood, she has repeatedly stated that painting pictures has been an inspiration and a form of therapy for her.” I would love to know the connection of this statement to the design aspects of Kusama’s work.

I enjoyed the first half elles:pompidou much better than the second half. The first half had works by Sonia Delaunay, Natalia Gontcharova, Romaine Brooks, Claude Cahun, Gisèle Freund, Suzanne Valadon, Dora Maar, Dorothea Tanning, and Geneviève Asse. In particular Tanning’s Portrait de famille (Portrait of a family) 1954 and Asse’s Triptyque lumière (Illuminated Triptych) 1970-1971 were standouts for me.

The second half of the show seemed to veer in a more in-your-face direction with Valie Export, Niki de Saint-Phalle, Nan Goldin, and other “disorienting” (for me that is) video works. I wanted to “get” Ana Mendieta’s Untitled (Chicken Piece Shot #2) and Carolee Schneerman’s Meat Joy 1964, but I didn’t. I registered them in my mind, but I couldn’t get beyond that. The one second-half piece that piqued my interest was Annette Messager’s Les Pensionnaires (The Boarders) 1971-1972 where taxodermied sparrows in hand-knitted clothes are arranged in eerie configurations, some with mechanized devices attached. Give me dead birds in little sweaters over video any day. Speaking of video, in the first half of the exhibit there was a video by Marie-Ange Guillemot called Mes poupées (My Dolls) 1993 which was a bit of an odd juxtaposition with what was immediately around it artwork-wise. In the video, the artist massages a dough-like object in a fold that looks like crotch.

Elles:Pompidou Map and Guide with Audio Stops

Sunday, January 13, 2013

Working with Your Solar Array Data Using the Enphase API

Overview

(This post last reviewed and steps verified October 2015. Note that WebMatrix has been retired since this was written.)

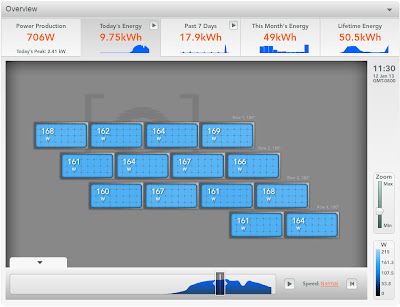
Left: Example Web Service Call Data;  Right: Enphase Graphic Showing Solar Panel Array
Example Web Service Call Data;Enphase Graphic Showing Solar Panel Array

This tutorial discusses a simple approach to working with your Enphase data. Enphase data is data that your solar array sends up into the cloud (Enphase servers) when your system uses the Enphase Envoy Communications Gateway (http://enphase.com/products/envoy/) with your Enphase microinverters. This system allows solar array owners to check the status of their system and view various aspects of the system's performance.

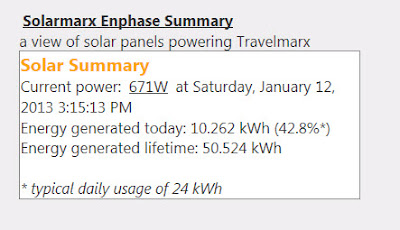
We recently installed 14 solar panels working with Solterra Systems and we were curious about how to access our data. It proved to be fairly straightforward. With a little programming background you can work with the data as you want, for example, exposing it in web pages and applications. 
Don’t know or want to do any programming? No worries, you you can still work with your Enphase data in several easy ways: 
  1. Probably the easiest non-programming approach is to just go to the site that Enphase provides for you. (Sites can be made public or remain private.) Enphase provides all sorts of graphs. For example: https://enlighten.enphaseenergy.com/public/systems/zVU7148952
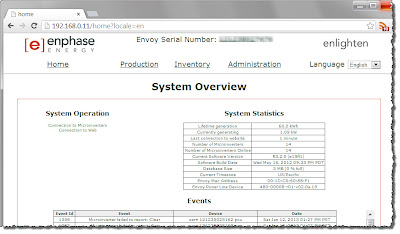
  2. The next easiest non-programming approach is to log on, locally, to your Enphase Envoy gateway device and view your data. This only works when you are at home, on your own network.

    The local site might be something like http://192.168.0.11 and it includes a couple of pages:

    Home page - System statistics and events.
    Production page - System energy production
    Inventory page - list of solar array panels (at least for us).
    Administration page

    It seems strange to have data about something physically near us pump its data out to the Internet where we then access back through the Internet. Why do we do this? Because the local data isn't easily consumable in any practical form other than viewing it in a browser. What we want are numbers we can manipulate and display as we want.
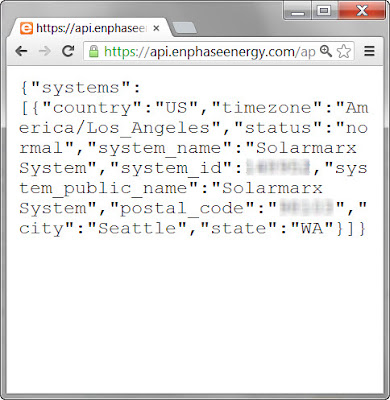
  3. A third non-programming approach is to get an API key as shown in Step 1 below and within a few moments you can create a URL that you can use in a browser to return data. It is pretty low tech, but it works wherever you are. Here’s an example of an URL: https://api.enphaseenergy.com/api/systems?key=<YOUR_KEY_HERE>.  More examples are shown in Step 2 below.
Left: Enphase Gateway Local Web View; Right: Testing API Calls in a Browser
Enphase Gateway Local View Testing API Calls in a Browser

Before we start in with the tasks, let's list the software components and hardware components we are using in the tutorial. 

Software Components

A Web service built with C# and a simple web page to display the results from that web service. Both are running in a free Windows Azure web instance. 
  • Why a web service? We can hide our Enphase API key and the web service is easy to create and use. You can have code for retrying or aggregation of different streams of data. Also, the web service can be leveraged from other clients (applications on other devices).
  • Why Windows Azure? Because we have a number of other projects hosted there and it made sense. They offer a free web site solution that is easy to use.
  • Is a hosting solution like Windows Azure necessary? No you can host the web service and web page on your local computer and it would work fine. We wanted to host the service in the Cloud so we could access it remotely.
  • What operating systems did we use for this tutorial? Development was done on both Windows 7 and Windows 8.
jQuery - a JavaScript library to simplify HTML Ajax interactions. 
  • Why? It’s easy to use jQuery in a web page to call the web service we created and put the data on a web page.
WebMatrix or Visual Studio - development tools that can publish to a Microsoft Azure web instance. 
  • Why? Free and relatively easy to use tools for creating web sites. The web sites can be used locally only and also published to a remote web site.
Enphase API 
  • Why? Well, because this API provides the access to the data about our system.  Thankfully, it is a fairly simple API to use with query strings that require your “key”. With each “call” to the API you can get different types of data back.

Sample code files for this blog post can be downloaded from Github.

Hardware Components


Enphase Envoy Comunications Gateway 
The tasks discussed in the rest of this tutorial: 

Step 1: Get Your Enphase API key.
Step 2: Get Familiar with Getting Enphase Data Using the API
Step 3: Set Up a Free Azure Web Site
Step 4: Create a Simple Web Service to Get and Display Enphase Data

Step 1: Get an Enphase API Key


Go to https://developer.enphase.com/docs/quickstart.html and follow the instructions. 

Step 2: Get Familiar with Enphase Data Using the API


The root URL for the API is http://api.enphaseenergy.com/api/. Assuming you have your API key, you can easily test the API calls in a browser. Note that some browsers show the returned JSON by default, other browsers might force you to open the file in another application (you can choose any program that can display text). 

Your API key is 32 characters long. For the sample URLs here we’ll use the example key = “11112222333344441111222233334444”. Other data below is displayed with XXXXXX to hide our system ID (different from the ID used in the public system URL above). Your system will show the appropriate data for your setup.

API: Get System Info


Use the index call.

Example Input

https://api.enphaseenergy.com/api/v2/systems?key=11112222333344441111222233334444 


Example Output

{"systems":[{"country":"US","timezone":"America/Los_Angeles","state":"WA","system_public_name":"Solarmarx System","status":"normal","postal_code":"XXXXXX","city":"Seattle","system_id":XXXXXX,"system_name":"Solarmarx System"}]}

API: Get Lifetime Energy


Use the energy_lifetime call.

Example Input

https://api.enphaseenergy.com/api/v2/systems/XXXXXX/energy_lifetime?key=11112222333344441111222233334444 


Example Output

{"production":[144,1390,8738,9344,9205],"start_date":"2012-12-30T00:00:00-08:00","system_id":XXXXXX}

API: Get Power Today


Use the stats call.

Example Input

https://api.enphaseenergy.com/api/v2/systems/XXXXXX/summary?key=11112222333344441111222233334444 

Example Output

{"system_id":148952,"total_devices":14,"intervals":[{"end_at":1445784600,"devices_reporting":1,"powr":4,"enwh":0},{"end_at":1445784900,"devices_reporting":1,"powr":30,"enwh":3},
....
{"end_at":1445815500,"devices_reporting":1,"powr":30,"enwh":3},{"end_at":1445815800,"devices_reporting":1,"powr":30,"enwh":3}]}


Notes 

There are as many items in the list as there are 5 minute intervals in the day. For example, for a day with 8 hours and 45 minutes of daylight, that's 525 minutes of daylight and 105 intervals. For more information, see the stats call.

Get Summary


Use the summary call.

Example Input

https://api.enphaseenergy.com/api/v2/systems/XXXXXX/summary?key=11112222333344441111222233334444 


Example Output

{"current_power":0,"energy_month":27287,"modules":14,"summary_date":"2013-01-04T00:00:00-08:00","source":"microinverters","energy_today":3773,"energy_lifetime":28821,"system_id":XXXXXX,"energy_week":28821}

Notes

Specify summary_date for a specific day. 
https://api.enphaseenergy.com/api/systems/XXXXXX/summary?summary_date=2013-01-02&key=11112222333344441111222233334444   

Step 3: Setting up a Free Azure Web Site

All the code shown in this step and the next (Step 4) will run locally and don’t require a remote web site. If you you only want to experiment with a local web site (on your computer), just skip the tasks that talk about creating a Azure web site and publishing remotely. 

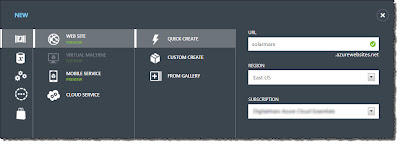
Step 3.1: Go to https://manage.windowsazure.com, create the site and download the publishing settings for the site. 
  • Assuming you already have an account established, you will create a free Azure web instance. In the Windows Azure Free instance, your web site runs in a multi-tenant environment, that is, you share resources. This is fine for what we are doing here. 
  • We call the site in this tutorial “solarmarx” which gets the domain name http://solarmarx.azurewebsites.net.  Call your site something appropriate for your situation. If you wanted to have a custom domain (like www.mycustomdomain.com), you can do that as an extra step.
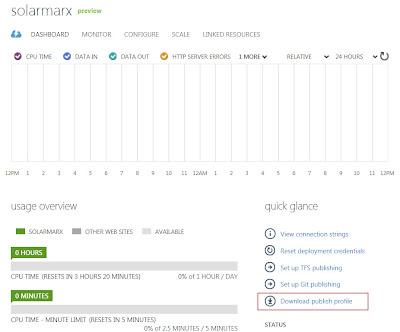
  • After you create the site, download the publishing settings which are used to tell you local programs (WebMatrix and Visual Studio Express) how to publish to the remote web site (in the Cloud).
Step 3.2: Create a local web site. 
  • Create a site using WebMatrix or  Visual Studio. Create an empty site then associate the site with the publishing settings. You can also create an fully functional local site first and and test it locally and then later associate the publishing profile.
Step 3.3: Make a change to your web site locally and publish to the remote site and verify. 
  • For example, edit the title of the Default.cshtml document and put some text in the body of the HTML file.
    <!DOCTYPE html>
    <html lang="en">
        <head>
            <meta charset="utf-8" />
            <title>Solarmarx</title>
            <link href="~/favicon.ico" rel="shortcut icon" type="image/x-icon" />
        </head>
        <body>
            <p>Welcome to Solarmarx!</p>
        </body>
    </html>
  • Select the Default.cshtml, right-click, and select Publish.

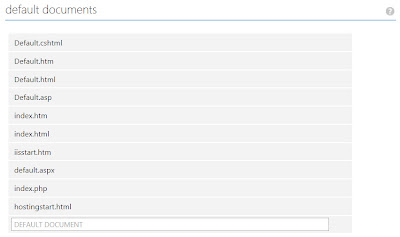
Step 3.4: In the Azure Management Portal for the web site, make sure Default.cshtml is one of the default document types for the web site. 


  • Go to the Configure page of the web site and look for the default documents section.
  • Add Default.cshtml as a document type.

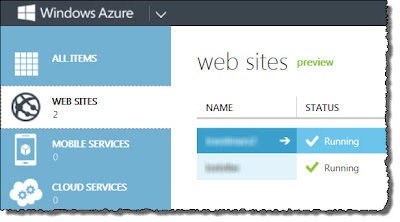
Left: Windows Azure Web Sites View, Right: Windows Azure – Creating a Web Site
Windows Azure Web Sites ViewWindows Azure – Creating a Web Site 

Left: Windows Azure Download Publishing Profile; Right: Setting Default DocumentsWindows Azure Download Publishing ProfileSetting Default Documents


Step 4: Create a Simple Web Service and Display Information


In this step of the tutorial, we show using Visual Studio Express 2012. You could also do the same work in WebMatrix2. You have several options for working with the web site you created. To open the site in Visual Studio Express 2012, use "Open Web Site" and find the Local IIS web site "Solarmarx" in our case. 

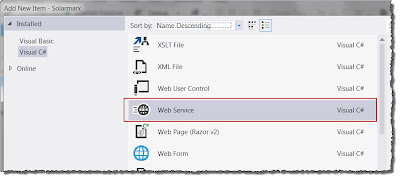
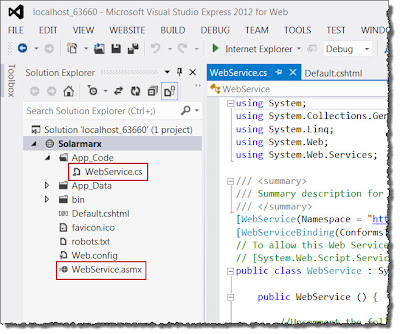
Step 4.1: Create a web service by create a new .asmx file.

Left: Create a new Web Service; Right: What Gets Created
  
Step 4.2: Put the code into the WebService.cs file as shown below. Below, an example key (11112222333344441111222233334444) is used. As well XXXXXX is used as the system ID. Fill in the correct values for your system.
using System;
using System.IO;
using System.Net;
using System.Text;
using System.Web.Services;

[WebService(Namespace = "http://solarmarx.com/")]
[WebServiceBinding(ConformsTo = WsiProfiles.BasicProfile1_1)]
// To allow this Web Service to be called from script, using ASP.NET AJAX, uncomment the following line. 
[System.Web.Script.Services.ScriptService]
public class WebService : System.Web.Services.WebService {

    public WebService () {

        //Uncomment the following line if using designed components 
        //InitializeComponent(); 
    }

    [WebMethod]
    public string HelloWorld() {
        return "Hello World";
    }

    [WebMethod]
    public string GetEnphaseStats()
    {
        String key = "11112222333344441111222233334444";
        String uri = "https://api.enphaseenergy.com/api/systems/XXXXXX/summary?key=" + key;
        WebRequest wrGETURL = WebRequest.Create(uri);

        Stream objStream = wrGETURL.GetResponse().GetResponseStream();

        StreamReader objReader = new StreamReader(objStream);

        StringBuilder sb = new StringBuilder();
        String sLine = "";

        while (sLine != null)
        {
            sLine = objReader.ReadLine();
            if (sLine != null)
                sb.Append(sLine);
        }
        return sb.ToString();
    }
    
}


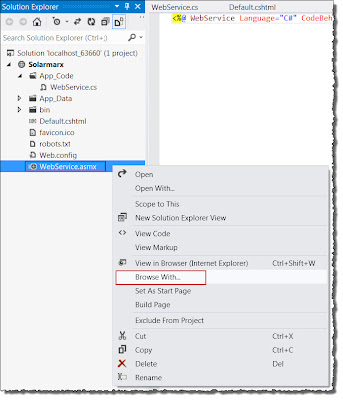
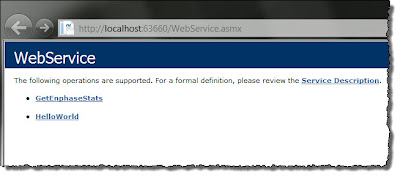
Step 4.3: Test the web service locally (on your computer) by selecting the WebService.asmx and browsing. 

Left: Browsing a Web Service Locally; Right: The Service Operations


Step 4.4: Create a basic web page that uses jQuery. 
<!DOCTYPE html>
<html lang="en">
    <head>
        <meta charset="utf-8" />
        <title>Solarmarx</title>
        <link href="~/favicon.ico" rel="shortcut icon" type="image/x-icon" />
        <script src="~/Scripts/jquery-1.8.3.min.js"></script>
        <script>
            $(document).ready(function () {
                alert('jQuery installed.');
            });
        </script>
    </head>
    <body>
        <p>Welcome to Solarmarx!</p>
    </body>
</html>


  • Install jQuery in a \Scripts folder. You can use the NuGet service to do that.
  • Test that you have installed jQuery correctly by making the changes shown above and viewing the Default.cshtml page

Step 4.5: Modify the web page as shown below to add script that calls the web service and puts the results in an HTML element on the page.
<!DOCTYPE html>
<html lang="en">
    <head>
        <meta charset="utf-8" />
        <title>Solarmarx</title>
        <link href="~/favicon.ico" rel="shortcut icon" type="image/x-icon" />
        <script src="~/Scripts/jquery-1.8.3.min.js"></script>
        <script>
            var webservicePath = "/WebService.asmx/";
            var pubLink = "https://enlighten.enphaseenergy.com/public/systems/zVU7148952";

            $(document).ready(function () {
                $.ajax({
                    type: "POST",
                    url: webservicePath + "GetEnphaseStats",
                    success: function (results) {
                        var res = jQuery.parseJSON($(results).text());
                        var avg_use = 24; // kWh per day
                        var d = new Date().toLocaleString();
                        var current_power = res.current_power;
                        var energy_today = res.energy_today / 1000;
                        var energy_lifetime = res.energy_lifetime / 1000;
                        var energy_today_perc = 100 * (energy_today / 24);
                        var summaryElement = $("<span id=\"enphaseTitle\">Solar Summary</span> <br/>" +
                                                "<span> Current power: <a target=\"_blank\" href=\"" + pubLink + "\">" + current_power + "W</a> at " + d + "</span > <br/>" +
                                                "<span> Energy generated today: " + energy_today + " kWh (" + energy_today_perc.toFixed(1) + "%*)</span> <br/>" +
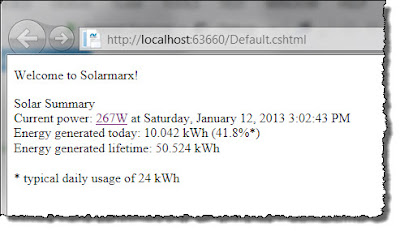
                                                "<span> Energy generated lifetime: " + energy_lifetime + " kWh</span> <br/>" +
                                                "<br/><span id=\"note\">* typical daily usage of 24 kWh</span>");
                        $("#enphaseStats").append(summaryElement);
                    },
                    error: function (result) {
                        alert(result.responseText);
                    }
                });
            });
    </script>
    </head>
    <body>
        <p>Welcome to Solarmarx!</p>
        <!-- data from webs service call goes here -->
        <div id="enphaseStats">    
        </div>
    </body>
</html>

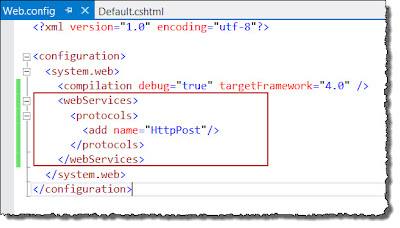
Step 5.5: If publishing remotely, you need to set configure HttpPost as a service that can be used. This is done in the web.config file. 


Step 5.6: Test locally, publish to the cloud (if you created a remote site), and test remotely.